City’s Net Position Continues To Deteriorate
As with the last fiscal year, we will be taking a look at the City’s most recent Consolidated Annual Financial Report (CAFR). While the City’s annual budget proceedings are the more closely watched annual fiscal event, the release of the CAFR is also extremely important. As the CAFR looks at the City’s long term financial commitments, it provides an important barometer on the City’s overall fiscal health. As we saw last year, the city’s Net Position has been declining for some time. Why is this important? As the CAFR notes, “The Statement of Net Position presents information on all of the City’s assets, deferred outflow of resources, liabilities, deferred inflows of resources, and net position. Increases and decreases in net position may serve as a useful indicator of whether or not the financial position of the City is improving or deteriorating.” Team TIF continues to believe that it is important that city residents and others have a clear understanding of the city’s fiscal position. As such, Team TIF believes that annual looks at both the budget proposals and the CAFR are important for St. Louisans who desire to know more about our city’s fiscal health.
Numbers Highlighted In This Year’s CAFR
Before we get into analyzing changes to the City’s Net Position, we should take a look at the highlights:
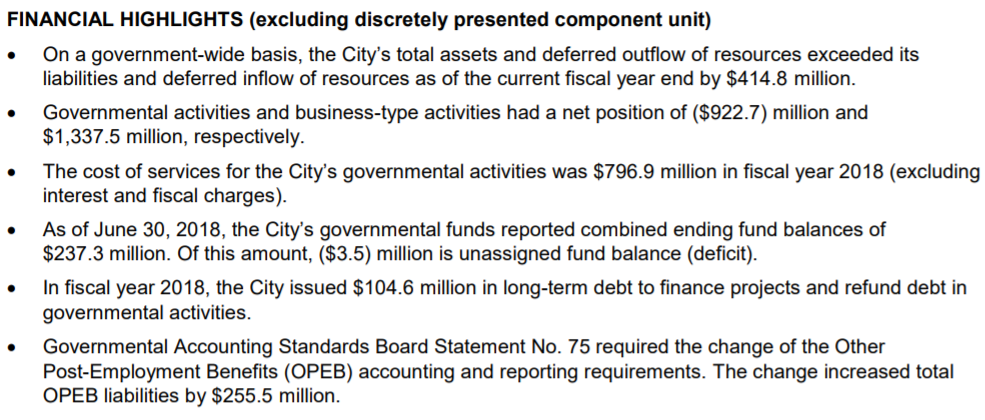
Obviously, the change from GASB 75 taking effect was significant. Essentially, this change has forced municipalities to begin factoring in more non-pension retiree benefits as long term liabilities. This one accounting rule change has reduced the City’s Net Position by over a third, since last year’s CAFR. The reduction to only $414.8 million in Net Position is not positive news for St. Louis City.
pg 8, FY18 CAFRTotal unrestricted net position decreased by $291.3 million for the year ended June 30, 2018 primarily due to the change in accounting and reporting regarding GASB Statement No. 75, OPEB liability.
The other likely driver of Net Position erosion is the debt issued for renovations on the Enterprise Center. While the debt had been approved, prior to the end of the last fiscal year, it wasn’t actually issued until this fiscal year.
Obviously, if the Net Position can be used as a measure of the city’s fiscal health, then this significant decline, on top of previous years’ declines, have put the city in a position of fiscal weakness. To give readers an example to use for comparison, Kansas City’s most recent CAFR found their Net Position stood at $4.9 billion. This means that KC’s assets exceed liabilities at the rate of about $10,000/resident, while STL’s assets only exceed liabilities by about $1,350/resident. If one agrees that Net Position is a barometer of a municipality’s fiscal health, then it is hard to see how this report doesn’t show the continuation of St. Louis City’s fiscal deterioration.
In addition to the changes brought by GASB 75, the Comptroller’s office identifies these as the most important drivers of long term liabilities.
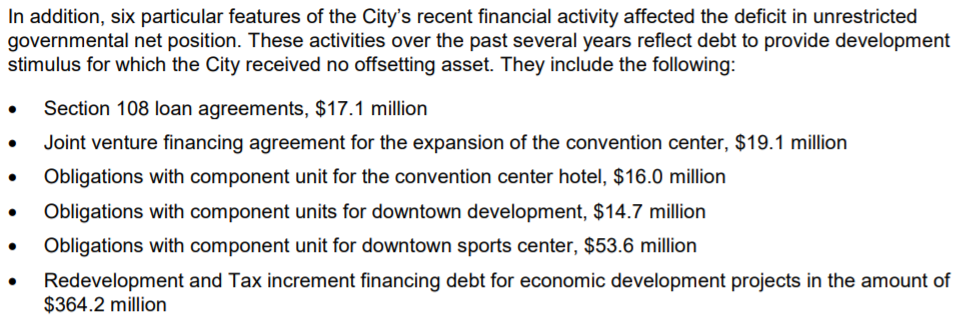
As we can see, TIF obligations continues to be a major portion of the city’s liabilities, and it appears that one can see the new Enterprise Center debt under the heading of “obligations with component unit for downtown sport center”.
The City Revenue Picture
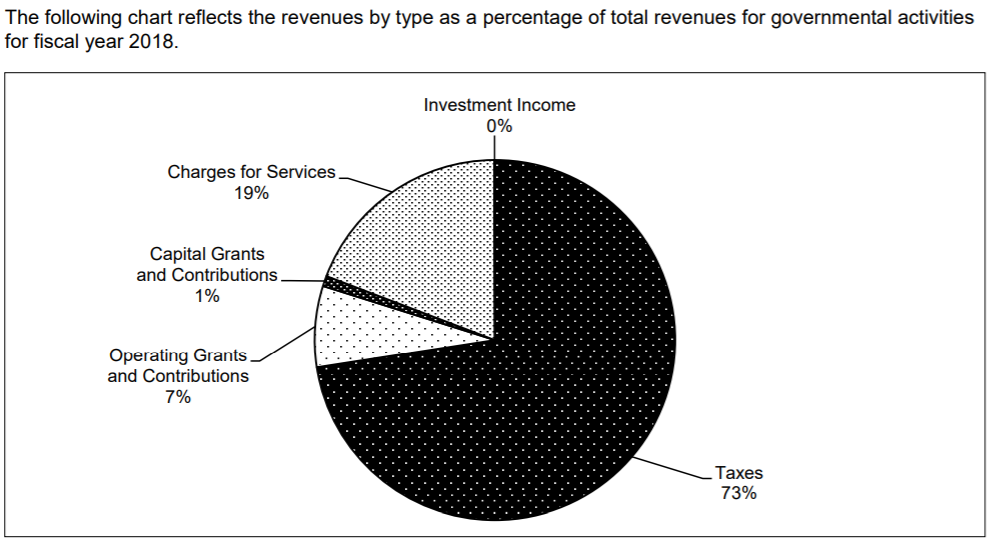
While there are some changes in the proportions of revenue streams, taxes stays steady at 73% of the city’s revenue, which is the same as the past fiscal year.
As would be expected, there are deviations from the estimates and actual receipts. While we are somewhat limited in the insights that can be drawn from these numbers, it does appear that the city either lost jobs or a decent number of jobs have moved into new developments that use TIF to recapture earnings and payroll taxes. While most tax streams were positive, both earnings and payroll taxes missed their estimates, with the earnings tax bringing in close to 3% less than budget projections assumed. In fact, while franchise taxes, property taxes and the building boom’s increased permitting brought in significantly more that budget estimates, overall revenue numbers missed estimates by close to 2%.
One point that is hard to miss would be the significant misses in public safety revenues. It appears that the public safety department brought in far less in charges for services. It is unclear why this stream was estimated to be so high or what caused the estimates to miss by more that 10%. Another point to note is that sales tax receipts continue to grow by less than the general rate of inflation. Despite significant incentivization, or arguably because of too much incentivization, sales taxes continue to lag behind the growth numbers one would hope to see in these reports.
Expenditures
As you can see, general government expenses largely came in lower than expected. One notable exception is the City Counselor’s office, which exceeded budget estimates by almost half of the amount approved in the approved budget. It is likely that most of this variance falls under “other expenses” for the office. It could be that this amount includes the costs of settlements, which may have come in far higher than expected.
It is also important to note that most city departments ran leaner than expected. Parks and Recreation, Convention and Tourism, Judicial and other departments all came in below budget. In Public Safety, the Fire Dept came in over budget and the SLMPD came in under, while the Director’s office came in over 10% higher than budgeted. It is also notable that the amount paid towards servicing interest on debt came in about 10% above what was originally budgeted.
Fiscal Impacts of Development Incentives
Thankfully, we are now in the second year of GASB 77-required revenue loss disclosures. This disclosure requirement has now brought the cost of tax abatements into the public eye. For many years, these cost were difficult to quantify, but the new rule has brought significant transparency to the costs of these programs. The effect of real estate tax abatements on the City’s main governmental budget is significant but less dramatic. Most of these losses are born by Saint Louis Public Schools (SLPS), the Zoo Museum District (ZMD), and other taxing jurisdictions that rely on property taxes. According to the CAFR, the following totals break down the negative impact of real estate tax abatement programs in FY2018:
- Chapter 353 residential abatement: $2,752,000
- Chapter 353 residential PILOT: $1,142,000
- Chapter 99 residential abatement: $4,895,000
- Enhanced Enterprise Zone tax incentives: $3,385,000
- Chapter 353 Commercial abatements: $5,325,000
- Planned Industrial Expansion: $68,000
- Chapter 353 Commercial PILOT: $3,809,000
- Chapter 99 Commercial abatement: $8,290,000
- Chapter 100 Industrial Revenue Bonds. Transactions - Personal Property: $906,000
- Chapter 100 Industrial Revenue Bonds. Transactions - Real Property: $374,000
- Chapter 100 Industrial Revenue Bonds. Transactions - Earnings Tax Incentive Credits: $821,000
Total losses to real estate tax abatement incentives is $31,767,000 About 60% of the lost revenues comes from the school district, while the City is projected to have lost roughly $6 million in annual revenues, based on estimates of the figures in this year’s CAFR. This would be equivalent to over half of last year’s $11 million budget shortfall.
Pensions Show Signs Of Improvement, But Caution Advisable
As with prior years, the city’s pension obligations are a major part of our long term fiscal picture. In a bit of good news, city employee pensions seem healthier. Last year saw a significant spike in liabilities, but this year brings relief, with the first reduction in years. Both firefighters’ pension systems, the police and the general employee pension fund all saw increasing fiduciary net positions increase as a percentage of their liabilities.
This does come with one note of caution, which is that almost all of the reduction can be contributed to great investment performance. The fiscal year ended June 30th, meaning that much of the recent stock market losses happened after the time covered in this report. As such, it could be that this improvement has been somewhat reduced, but it is encouraging to see the city’s liabilities declining in the police pension fund.
Trend In Net Position Indicates Continued Fiscal Deterioration
While much of the change is due to the new GASB reporting requirements, the city’s loss in Net Position exceeds the amount due to the reporting requirement change, which means that the city’s Net Position continues to deteriorate, reporting changes notwithstanding. Sadly, it is now at less than a third of where it stood in 2009. While the city has been wisely increasing our reserve fund, it is unclear if these increases will be able to stave off another credit downgrade, in light of the significant erosion in the city’s Net Position.
Further there are additional debt issuances and obligations entered into after the end of this fiscal and calendar year. There is also mention of the transfer of $10 million from the Treasurer’s office to the city’s reserve fund (pg 150-151, FY18 CAFR).
Conclusion
As we showed earlier, the City’s Net Position is in far poorer shape, compared to our friends in the state’s other economic powerhouse, Kansas City. With the possibility of a recession in the next year being regularly discussed, we are also likely to see revenue declines and an increase in unfunded pension liabilities, as the values of securities held by their funds’ decline. While the building boom has boosted revenues from permitting, the failure to hit budget estimates in the two revenue streams directly tied to wages and salaries (earnings and payroll taxes) failed to hit their mark. In many ways, we are now seeing the impact of the last year of the Slay administration, as many numbers in this year’s CAFR (ala permit fees on projects approved in his last year and the new debt for the Enterprise Center) are actual attributable to his final year. Overall, the city’s position continues to decline and is likely to continue doing so, as we have moved closer to another economic downturn.